
Performance testing is a crucial aspect of software and web applications today. Knowing if the application can handle the load without crashing in various scenarios and on different platforms is essential. The most outstanding tool used to do so is the JMeter. In this article, you will find everything needed to understand how to automate performance testing using JMeter.
What is Performance Testing
Performance testing is non-functional testing that assesses a system's performance under real-time load conditions. It evaluates the system's response to various states, simulating multiple users accessing the program simultaneously. This testing measures the speed and capacity of the program, which is essential for understanding its behavior under normal and peak conditions. Its primary aim is to ensure optimal performance when numerous users attempt to access or use the application simultaneously.
Why is Performance Testing Necessary
Vince Lombardi said, "It takes months to find a customer, but it only takes seconds to lose one." The importance of application performance cannot be overstated. It is crucial to conduct performance testing to help ensure that your applications function efficiently and can handle the user's demands.
It can also assist you in identifying possible bottlenecks and addressing them before they become a nuisance. Doing so guarantees that your application runs smoothly and effectively, giving your users a better experience. Start with performance testing to ensure your apps perform correctly and provide the most incredible user experience possible. You can also familiarize yourself with our article on how to do performance testing, which provides detailed insights into optimizing software applications through performance testing.
In brief, performance testing is essential for businesses since it gives vital insights to guarantee that systems run optimally before deployment.

Request our dedicated QA presentation for your team.
Types of Performance Testing
At present, the most researched directions in performance testing, which address the performance indicators of software, include:
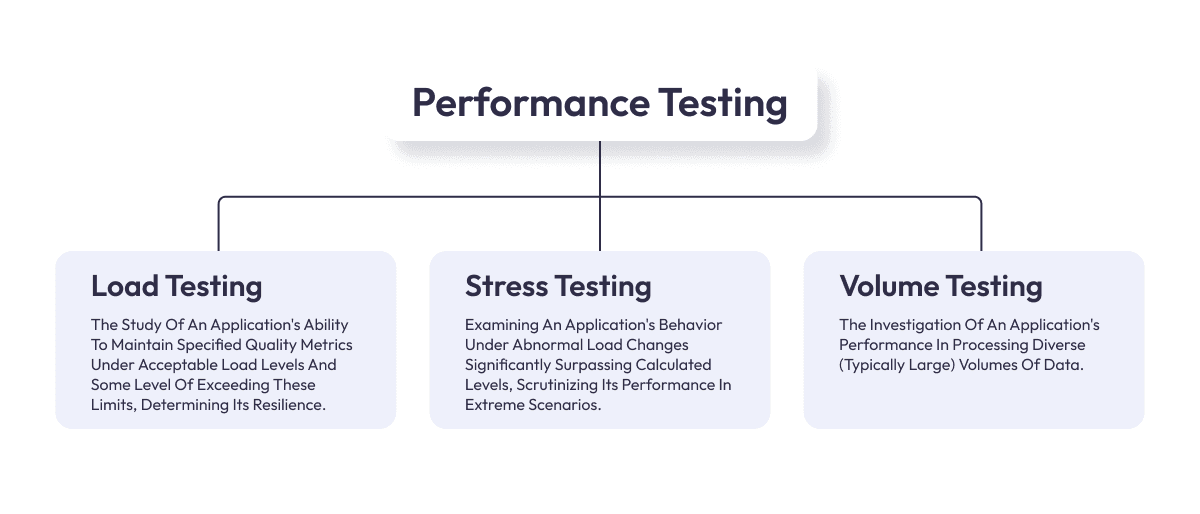
- Load Testing - The study of an application's ability to maintain specified quality metrics under acceptable load levels and some level of exceeding these limits, determining its resilience.
- Stress Testing - Examining an application's behavior under abnormal load changes significantly surpassing calculated levels, scrutinizing its performance in extreme scenarios.
- Volume Testing - The investigation of an application's performance in processing diverse (typically large) volumes of data.
The objectives of each type of performance testing are:
Performance Testing
- Assessing the response time of operations based on a defined intensity and execution sequence.
- Evaluating the system's response to changes in the number of users concurrently interacting with the application.
- Determining the limits of load intensity beyond which performance becomes unacceptable.
- Measuring the scalability of the application based on performance metrics.
Load Testing
- Evaluating the application's response time under different load values within acceptable thresholds.
- Assessing the utilization of system resources by the application under varying load conditions.
- Examining how the application's behavior changes over time while maintaining a consistent and acceptable load for an extended duration. Read our article on how to do load testing to find out more about load testing.
Stress Testing
- Assessing the application's response to unconventional and stressful changes in load intensity.
- Evaluating the application's performance under significantly higher loads than the defined acceptable limits.
- Testing the robustness of the application when subjected to intensive use of performance-critical functions.
Volume Testing
- Evaluating performance metrics when processing, handling, and generating data of different volumes and computational complexities.
- Assessing the application's ability to handle large data volumes under highly utilized system computational resources.
- Testing the application's ability to process extensive data volumes with limited memory.
The analysis of data mentioned above, allows us to conclude that the direct or indirect goals of any performance-related testing are:
- Identification of system "bottlenecks" (functions of the software-hardware complex, accessing which leads to the most significant performance degradation).
- Determination of the optimal system architecture and selection of the best platform, tools, and implementation languages.
- Identification of the optimal way to store files.
- Determination of the nature of the increase in system response time under increased load.
- Identifying the maximum number of concurrently active users, surpassing which renders the system unusable.
- Determination of the impact of system configuration on performance.
- Assessment of the compliance of the network infrastructure with performance requirements.
The Necessity of Performance Test Automation
Automating performance testing is becoming increasingly essential in the fast-paced, technology-driven world. This shift towards automation brings numerous benefits and addresses challenges inherent in manual performance testing. Here's why automation in performance testing is not just a luxury but a necessity:
- Enhanced Efficiency and Speed: Automated testing significantly reduces the time required to test complex applications and large data sets. Manual testing can be time-consuming, while automated tests can run faster and more frequently.
- Repeatability and Consistency: Automated tests can be repeated precisely, ensuring consistency in testing conditions and results. This repeatability is crucial for accurately comparing performance metrics over time or after changes to the system.
- Scalability of Tests: Automated performance testing allows for easy scaling of tests to simulate thousands or even millions of users, which is often impractical or impossible with manual testing.
- Early Detection of Bottlenecks: Automation facilitates the early detection of performance issues. It enables continuous testing during the development phase, helping to identify and resolve bottlenecks before they escalate into more significant problems.
- Cost-Effectiveness: Although the initial setup for automated testing can be resource-intensive, it becomes more cost-effective in the long run. Automated tests can be run repeatedly without incurring additional costs, making them more economical compared to the recurring costs of manual testing.
- Integration with Development Processes: Automated performance testing can be integrated into CI/CD pipelines. This integration ensures that performance testing is a regular and integral part of the development process, leading to faster and more reliable releases.
Automating performance testing is crucial for modern software development and deployment. It enhances the efficiency, accuracy, and reliability of the testing process. It aligns perfectly with the needs of agile and DevOps practices, ensuring high-quality software delivery in today's competitive and demanding technological landscape. If you are new to performance testing, read about what JMeter is. And how does JMeter work?
What is JMeter
When looking for tools to test a website or application's performance, many options are available in the market. These include free, open-source, and commercial-based tools. A popular option for this purpose is Apache JMeter. JMeter is an open-source Java-based performance testing tool widely used to run load tests against various web and software services, APIs (SOAP and REST), web applications, and other web services. It was one of the earliest tools introduced to the performance testing market, which is still popular and widely used today.
JMeter – How it Works
JMeter is a tool that maps visitors to your application or service by enabling users to make and send various requests, such as HTTP, FTP, JDBC, etc., to a server. The server collects response data and displays it on Listeners, which users can edit. By analyzing the data collected from these reports, users can quickly identify operational bottlenecks or areas for improvement. However, it is essential to note that JMeter is not a browser and only works at the protocol level, which means it cannot display JavaScript or support all actions performed by a client or user.
Despite this limitation, JMeter offers features and elements like cache manager, cookie manager, and header manager, which allow it to act and perform more like a real browser. JMeter is a Java-based desktop application, so before you start using it, you must meet various prerequisites, such as installing the latest version of Java and meeting the minimum system requirements. It may take additional time and resources compared to SaaS-based load testing tools.
With JMeter, you can avoid losing customers due to slow performance and keep your software in top shape.
Guide to Learn How To Automate Application Using Apache JMeter
Before embarking on the journey of automated performance testing using JMeter, ensure that you have the following prerequisites in place:
Prerequisites
- Java Installation: Apache JMeter operates on the Java platform. It is imperative to have Java installed on your system. The latest version of Java can be obtained from the official website.
- Apache JMeter: Download the latest version from the official Apache website and install it on your system. JMeter is platform-agnostic and compatible with Windows, macOS, and Linux. Download Apache JMeter: Click Here
Automating performance testing with Apache JMeter involves setting up your test scenarios, configuring JMeter for automation, and integrating it into your continuous integration/continuous deployment (CI/CD) pipeline. Here's a step-by-step guide:
Step 1: Creating a Test Plan
A test plan, the cornerstone of performance testing in JMeter, encapsulates a constellation of elements defining the scope and intricacies of the performance tests. The creation process entails the following steps:
Thread Group Configuration
- Number of Threads (Users): This parameter defines the number of virtual users that will simulate traffic on the application under test. It directly influences the concurrency level of the test.
- Ramp-Up Time: Ramp-up time specifies the duration over which virtual users are introduced into the test. For example, a ramp-up time of 10 seconds for 100 threads will initiate ten threads per second.
- Loop Count: Loop count determines the number of times the Thread Group will execute, ensuring the repetition of the test.
Sampler Configuration
Incorporate a Sampler into your Thread Group to emulate requests to the application. For web applications, HTTP Request Samplers are commonly used. Detailed configuration comprises:
- Protocol: Specify the communication protocol, such as HTTP or HTTPS.
- Server Name or IP: Define the target server's domain name or IP address.
- Port Number: Set the port number for server communication, such as 80 for HTTP and 443 for HTTPS.
- Path: Provide the resource's path, such as "/login" for a login page.
Assertions and Logic Controllers
Realistic user behavior simulation is facilitated by incorporating Assertions and Logic Controllers into the test plan:
- Assertions: These components validate server responses. For instance, Response Assertions can ensure that the server returns specific text or status codes.
- Logic Controllers: They manage request flow and structure within the test plan, proving invaluable for simulating user navigation across multiple pages or actions.
Listeners Configuration
While running test cases, JMeter gathers information that Listeners can access. These Listeners can also direct the data to a file for future use. Each listener in JMeter provides a field to indicate the file where data should be stored. A Configuration button allows users to choose which fields to save and whether to use CSV or XML format.
There are several types of Listeners such as view results tree, summary report, graph results etc.
- Summary Report: you can easily get the performance matrices of each request, such as the number of samples processed, the average response time, throughput, error rate etc.
- View Results Tree: you can see all the details related to the request as well as HTTP headers, body size, response code etc. In case any request failed, you can get useful information from this listener for troubleshooting a specific error.
- Graph Results: you can see a graphical representation of the throughput vs. the deviation of the tests.
You can add one or more Listeners according to your needs.
Step 2: Configuration of Test Data
Configuring test data is often essential to augment realism in performance tests. JMeter provides various mechanisms for this purpose:
- CSV Data Set Config: This element allows data retrieval from CSV files, enabling parameterization of tests with diverse values.
- Random Variable: Generate randomized data, such as usernames or product IDs, to emulate varied user behavior.
- User-Defined Variables: These custom variables are reusable values throughout the test plan. For instance, a base URL can be defined as a User Defined Variable and referenced across HTTP Request Samplers.
Step 3: Test Execution
With the test plan fully configured, it is time to execute the performance tests. The execution process unfolds as follows:
- Saving the Test Plan: Before test execution, ensure the test plan is saved. It can be done through the "File > Save Test Plan" menu.
- Initiating the Test: Launch the test by clicking the green "Start" button or using the shortcut "Ctrl + R." This action commences the simulation of user requests per the predefined configuration.
- Progress Monitoring: As the test unfolds, JMeter provides real-time insights into the progress of the test via various Listeners.
- Result Analysis: Post-test completion, comprehensive result analysis becomes imperative.
JMeter offers a suite of built-in Listeners, including View Results Tree, Summary Report, Aggregate Report, and Response Times Over Time, for in-depth evaluation of performance metrics and server responses.
Step 4: Report Generation
Comprehensive and visually appealing reports are integral to conveying performance test results effectively. Consider the following avenues for report generation:
- JMeter Plugins: JMeter Plugins extend reporting capabilities by offering an extensive array of additional Listeners and reporting options.
- Integration with Reporting Tools: Besides JMeter's native reporting features, integration with external reporting tools such as Apache JMeter Report Dashboard or Grafana provides customizable dashboards and enhanced reporting capabilities.
Step 5: Automation
To automate performance testing using Apache JMeter is paramount for continuous testing and seamless integration into the development pipeline. The automation phase can be detailed as follows:
- CI/CD Integration: Incorporate JMeter into your CI/CD pipeline, leveraging tools like Jenkins to automate performance tests after code changes or deployments. This ensures that performance testing remains an integral part of the development process.
- Scheduled Tests: Implement scheduling tools or scripts to orchestrate performance tests at specific intervals or times. Scheduled tests effectively uncover performance regressions.
- Cloud-Based Execution: Consider harnessing cloud-based services for distributing and executing tests across diverse locations. This approach emulates real user traffic patterns and geographically varying performance conditions.
Implementing performance testing automation using JMeter allows for the creation of realistic test scenarios and the execution of tests with multiple virtual users.
Creating Realistic User Scenarios for JMeter Performance Testing
JMeter provides the feature to record and replay traffic between a browser and a server, which allows for the creation of scripts that mimic user interactions. However, the effectiveness of performance testing lies in the realism and accuracy of these user scenarios. Performance testing automation using JMeter is essential for efficiently and effectively validating the performance of web applications.
Here's a guide on creating user scenarios that closely mirror real-world conditions:
1. Replicate Real User Behavior: Record user scenarios that emulate actual user behavior on your website or application. It includes navigating pages, submitting forms, and interacting with dynamic content. To record user interactions for script creation in JMeter, follow these steps:
- Set up the HTTP(S) Test Script Recorder: This involves configuring JMeter to act as a proxy server to intercept and record HTTP requests sent by your browser. To do this, add the HTTP(S) Test Script Recorder to your Test Plan by right-clicking on the Test Plan > Add > Non-Test Elements > HTTP(S) Test Script Recorder.
- Configure Browser Proxy Settings: Adjust your web browser's proxy settings to point to the JMeter proxy. Typically, you'll set the proxy host to 'localhost' and the port to the one specified in the HTTP(S) Test Script Recorder (default is 8888).
- Start Recording: In JMeter, click the 'Start' button in the HTTP(S) Test Script Recorder. This will start JMeter's proxy server and enable it to capture HTTP requests.
- Perform User Interactions: With the recording started, use your web browser to interact with the application you want to test. Navigate through the application, click buttons, submit forms, and perform any other actions you want to include in your script.
- Stop Recording: Once you've completed recording the desired interactions, go back to JMeter and click the 'Stop' button in the HTTP(S) Test Script Recorder. This will stop JMeter's proxy server from capturing further requests.
- Review and Customize: After recording, review the recorded HTTP requests in the HTTP(S) Test Script Recorder. You can customize the recorded script as needed, such as adding assertions, correlation, or parameterization to make it more robust and realistic.
- Save Script: Save your recorded script in JMeter for future use. You can save it as part of your Test Plan or as a separate script file.
2. Mimic Production Environment: For accurate performance measurement, it's vital that the testing environment closely resembles the production environment. It includes using similar hardware, network conditions, and software configurations.
3. Textual Environment Similarity: Strive for a production-like textual environment to represent real-world scenarios accurately. It includes data volumes, user profiles, and content.
4. Production, Prod-Like, Scale-Down, Wrong:
- Production: Create scenarios that replicate the exact conditions of your live production environment. It ensures that your performance testing reflects what users experience in real-time.
- Prod-Like: For variations in the test, consider "prod-like" scenarios that simulate expected peak loads or specific user activities that might stress the system.
- Scale-Down: Test scenarios where resources are scaled down to gauge the application's performance under reduced infrastructure. This helps identify potential bottlenecks when operating with limited resources.
- Wrong: Introduce scenarios where users perform actions incorrectly or encounter errors. It helps assess how well the application handles unexpected user inputs or erroneous interactions.
5. Run Tests to Verify Stability: Execute the recorded user scenarios in multiple threads to simulate concurrent user activity. Verify the system's stability under different loads and identify performance issues or bottlenecks.
6. Understand Scalability: Recognize that scalability is not always linear. Simply adding more resources doesn't guarantee proportionate performance improvement. Identify potential unexpected bottlenecks or limitations that may arise as the system scales.
7. Measure Server and Client-Side Performance: Performance measurement should cover server and client-side aspects. Assess server response times, resource utilization, and errors. Simultaneously, monitor client-side metrics such as page load times, rendering speed, and user experience.
Utilizing performance testing automation using JMeter enables the identification and resolution of performance bottlenecks in the early stages of software development.
Practical Examples
JMeter, a powerful tool for performance testing, offers various load-testing scenarios to help you understand the testing process. Every JMeter load test requires a well-thought-out testing plan. Assuming you have installed JMeter on your workstation, you can independently extract lessons from these examples to evaluate applications. However, seeking expert assistance is recommended if you need more prior experience. Let's get started.
Example 1: Testing a Web Application
In this example, we'll demonstrate how to set up a JMeter test plan for load testing a web application. The plan includes configuring thread groups, defining HTTP requests, and analyzing results using Listeners.
Objective: Load test a simple web application to simulate multiple users accessing the site simultaneously.
Tools Required:
JMeter (Download and install from Apache JMeter website)
Scenario: Assume you have a web application hosted at http://example.com with the following pages:
- Home Page
- Login Page
- Product Page
Load Test Steps:
Create a New Test Plan:
- Open JMeter and create a new test plan.
- Right-click on the Test Plan and add a Thread Group (Add > Threads (Users) > Thread Group).
Configure Thread Group:
- Set the number of threads (simulated users) to, for example, 50.
- Set the ramp-up period (time to start all threads) to 10 seconds.
- Set the loop count to the number of times you want each thread to repeat the test.
Add HTTP Request Defaults:
- Right-click on the Thread Group and add Config Element > HTTP Request Defaults.
- Set the "Server Name or IP".
Add HTTP Requests:
- Right-click on the Thread Group and add Sampler > HTTP Request.
- For the path, enter to simulate users visiting the home page.
- Add more HTTP Requests for login and products to simulate users navigating the application.
Add Listeners for Results:
- Right-click on the Thread Group, add Listener > View Results Tree.
- Right-click on the Thread Group and add Listener > Summary Report.
- These Listeners will display real-time and summary results of your test.
Run the Test:
- Save your test plan.
- Click the "Run" menu, then select "Start" to run the test.
Analyze Results:
- After completing the test, check the View Results Tree and Summary Report results.
- Look for metrics like response times, throughput, and error rates.
Tips:
- You can add assertions to check if specific elements or texts are present in the response to validate the correctness of the application.
- Adjust the number of threads, ramp-up time, and loop count based on your requirements and your application's capacity.
This example provides a basic setup for load testing with JMeter. Depending on your specific requirements, you may need to customize the test plan further.
Example 2: Testing for an E-commerce Website
When it comes to load testing an e-commerce application, preparation for regular and seasonal sales events is crucial. Events like Black Friday attract more customers, leading to a potential increase in visitors. Considering that an e-commerce platform might still develop, you should perform JMeter load testing by designing unique users.
Testing Plan and Results:
- Set Up a Realistic Funnel: For an e-commerce site, customers typically visit the homepage, search for a product, add it to the cart, and check out. In JMeter, you can find the "Throughput Controller" option, where you set the throughput and the 'Funnel' option under the 'Thread Group' drop-down on the left interface panel. These parameters help define the user ratio. In this example, testers have set up a funnel where 100% of virtual users visit the homepage, 90% search for a specific product, 60% add the product to the cart, and only 35% complete the purchase. Since the test is based on assumptions, the throughput and funnel are 90%.
- Add Think Time: To obtain realistic results, JMeter allows adding "think time," determining the time real users take to select a product. They are informally referred to as pauses and should be included in the test case to ensure close-to-real results. For this example, testers have set 750 milliseconds in the "Thread Delay Properties" for random delays and a constant delay of 200 milliseconds. This is accomplished using the "Uniform Random Timer" in the control panel.
- Thread Group Parameters: Similar to Example 1, include "Number of Threads," "Ramp-Up Period," and "Loop Count" by clicking on the "Thread Group" option. The properties for this example are: Number of Threads (Users): 100, Ramp-Up Period (in seconds): 1, Loop Count: 50.
- Create Unique Virtual Users: Compile a list of users with unique names, IDs, passwords, contact information, and all necessary data during checkout. Add product keywords to allow virtual users to behave like real users. Ensure the information you include in the list exists on the website. Once the list is complete, save it as a CSV file and import it into JMeter during load testing.
- Add Graph Results: Include 'Graph Results' to visualize the results graphically. You can follow 'Step 3' of Example 1 to add graph results.
- Interpret Test and Results: After the 14th test, a testing report is provided. The visual representation shows a throughput of 64,186 per minute, while the deviation is 122 (higher than the throughput). This indicates that the e-commerce website cannot handle 100 users in one minute and can only cope with less load than expected. Therefore, you must address these issues to ensure the website passes the load test.
Depending on factors such as processor power, testing environment, internet speed, etc., JMeter load testing may yield different results. Hence, it's recommended that professionals handle the test, as they have sophisticated resources that ultimately show actual results.
Conclusion
JMeter is one of the performance testing tools that can help experts run performance and load testing for web applications. By following the steps outlined in this guide and leveraging the benefits of JMeter, you can enhance the reliability and scalability of your software. Embrace performance testing automation to stay ahead in the competitive world of software development. Automated performance testing using JMeter streamlines the process of assessing application scalability and responsiveness. Now you know how to use JMeter for performance testing effectively! Are you interested to know more and want to hire some of our professionals? Contact us today. We are happy to chat.
Comments
There are no comments yet. Be the first one to share your opinion!
For 8 years, we have helped more than 200+ companies to create a really high-quality product for the needs of customers.
- Quick Start
- Free Trial
- Top-Notch Technologies
- Hire One - Get A Full Team
Was this article helpful to you?
Looking for reliable Software Testing company?
Let's make a quality product! Tell us about your project, and we will prepare an individual solution.
FAQ
Performance testing aims to assess a system's behavior under real-time load conditions, evaluating its responsiveness, speed, and capacity to ensure optimal performance in average and peak scenarios.
Performance testing is crucial for applications to guarantee efficient functionality, handle user demands, identify potential bottlenecks, and ensure a smooth user experience.
The main types of performance testing include Load Testing, Stress Testing, and Volume Testing. Each type focuses on aspects such as responsiveness, load handling, resilience to stress, and processing large volumes of data.
The key benefits include enhanced efficiency and speed, repeatability and consistency in testing conditions, scalability of tests to simulate thousands of users, early detection of bottlenecks, cost-effectiveness in the long run, and integration with development processes (CI/CD). Implementing automated performance testing using JMeter empowers teams to identify and address performance bottlenecks early, ensuring optimal application performance and user experience.
Luxe Quality has a team of experienced QA engineers who specialize in performance testing using JMeter. We ensure thorough test coverage, efficient automation, and deep analysis of performance bottlenecks. With over 200 successful projects and a global client base, we provide reliable testing services that guarantee scalability and stability for your applications. Plus, we can quickly assemble a team to meet your project's specific needs, starting within 24 hours.